Introduction to pathway enrichment (I)
The second chapter of the RECeSS project aims at providing interpretable classification (into positive and negative associations) of drug-disease pairs. But what do we mean by interpretability? The main question we want to answer is “Why did the classifier predict this positive or negative outcome?”, that is, how we can connect the information about the drug and the disease and the predicted type of association. Intuitively, we would like to know how much a specific input to the classifier impacts the predicted outcome.
However, when the information about drugs and diseases involves the activity of genes in treated individuals/patients, most of the time, the interpretability comes from determining which disease-related biological function is triggered or inhibited by the drug. For instance, in order to treat cancer cells, a drug that targets the cellular death function might be interesting, since we would like to kill the cancer cells (however, it is seldom as easy as this). Several genes can be connected to a specific biological process, molecular function or cellular component, and conversely, a gene can be involved in several of these processes. A group of genes annotated with a biological function is called pathway. These genes within a group might interact and regulate each other (signaling pathway), for instance. Then, if we manage to connect the predicted outcome of a classifier to one or several impacted (“enriched”) pathways, then we can provide biologically meaningful justifications for further investigating the corresponding drug-disease pair.
Such a concept can (and has mostly been) be applied beyond drug repurposing, for instance, to compare healthy individuals and patients based on gene activity and connect specific pathways to the disease. At any rate, given a set of genes with some kind of ranking that quantifies their contribution to the difference in gene activity between two groups of samples, pathway enrichment aims at determining which functional groups of genes are the most discriminating.
We will present below two of the most common approaches to perform pathway enrichment, both with their pros and cons. We will use WebGestalt [1] to run those analyses online.
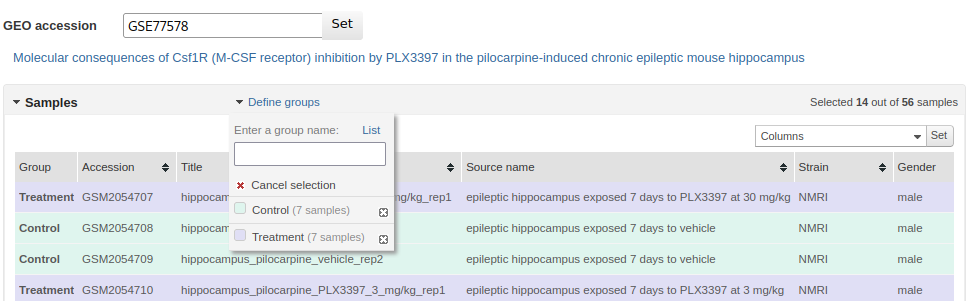
As a running example, we will consider a list of genes for which a differential analysis has been run on groups of epileptic mouse brains exposed to a control (7 samples) and exposed to an inhibitor of the gene CSF1R (7 other samples) [2]. If you would like to reproduce that list, go to this page and follow their instructions, by defining first the control group (“Vehicle”) and then the treatment one (“PLX3397”), and by setting the $p$-value cutoff to 0.0 in the Options tab. The resulting table can also be downloaded here. Genes are identified by their gene symbol and we removed genes where the symbol is missing. The reason is because most gene annotations use gene symbols, and the automatic conversion made by WebGestalt is time-consuming.
Compared to the file that is built by GEO2R, we added another column, named “score”, which corresponds to the ranking value we will use to quantify the contribution of each gene. The score for the gene $g$ is
\[\text{score}(g) := -\log_{10}(\text{padj}) \times \text{log2FoldChange},\]and has the greatest postive values for up-regulated genes, which are significantly (small padj) more active (large positive log2FoldChange) in mouse brains exposed to the CSF1R inhibitor, and conversely the greatest negative values for down-regulated genes, which are significantly (small padj) less active (large negative log2FoldChange) in mouse brains exposed to the CSF1R inhibitor. Thus the top and the bottom genes of the ranking are the ones that contribute most to the change between controls and treated samples.
Choice of gene functional annotations
There are several annotations for genes, that may list different types of pathways and functions. Unfortunately, those annotations are often sparse, because they are manually built and curated: for instance, seldom studied genes might not be reported. The most popular gene sets are from Gene Ontology (referring to biological processes, metabolic functions and cellular components), MSigDB (gene functions) and KEGG (signaling pathways). However, most of the annotation effort target human (Homo sapiens) genes. When dealing with other species (for instance, the mouse in our case), the problem is either to look for species-specific annotations, which might be extremely sparse and not provide strong enough statistical results, or to try and recover one-to-one homolog human genes, that is, genes that match human genes in terms of DNA sequence or function$^*$. None of these solutions is best.
The selection of the functional annotation should be guided by the objective of the study to provide the better overview of the mechanisms accounting for changes between sample groups. Fortunately, Webgestalt already embeds several of these annotations for the most common species (human, mouse, rat), so that the user does not have to worry about downloading and potentially formatting them.
In the remainder of the blog post, we will consider the “Gene Ontology Biological Process” gene sets for the mouse (Mus musculus).
1. OverRepresentation Analysis (ORA)
1.1 Definition
As previously mentioned, we are looking for enriched pathways, that is, overrepresented sets of functionally related genes, among the genes that are at the top and the bottom of the ranking. That overepresentation should be understood as a statistical meaning. That is, a pathway is overrepresented among a list of up-regulated (respectively, down-regulated) genes if genes from that same functional pathway are more frequent in this list than what is expected by chance. In mathematical terms, we want to compute the probability $p$ of more than $k$ genes from the same pathway P appearing among $n$ distinct genes of interest. Several distributions can be used to estimate that probability, for instance, the hypergeometric test [3]
\[p = 1 - \sum_{i=0}^{k-1} \frac{\left(^{|P|}_i \right) \left(^{N-|P|}_{n-i} \right)}{\left(^{N}_{n} \right)}\;,\]where $N$ is the number of genes for which the activity has been measured (also called the background). To perform pathway analysis on all gene sets, this hypergeometric test is run for each gene set in the annotations, and then the resulting probabilities are corrected for the number of sets, leading to false discovery rates (FDR) per pathway. Enriched pathways correspond to gene sets with low FDR and high statistic values for the hypergeometric test.
1.2 Running an ORA with WebGestalt
We proceed separately for up-regulated and down-regulated genes. From the table downloaded from GEO2R, we create a file with the extension up.txt with only the gene identifier column for genes where the score is higher than 1.301$^{**}$ ($\approx 60$ genes in total). Similarly, we filter for genes with score lower than -1.301 in a down.txt file to build the set of down-regulated genes. Finally, we instanciate the background set in .ref.txt with the identifier for all genes present in the initial table. We remove the column titles.
Once on WebGestalt, we select the species (Mus musculus), the gene annotations (Functional database > geneontology, Biological Process NoRedundant), and upload the lists of up-regulated (respectively, down-regulated) and background genes with the proper identifier type. At that point, you should see the following page
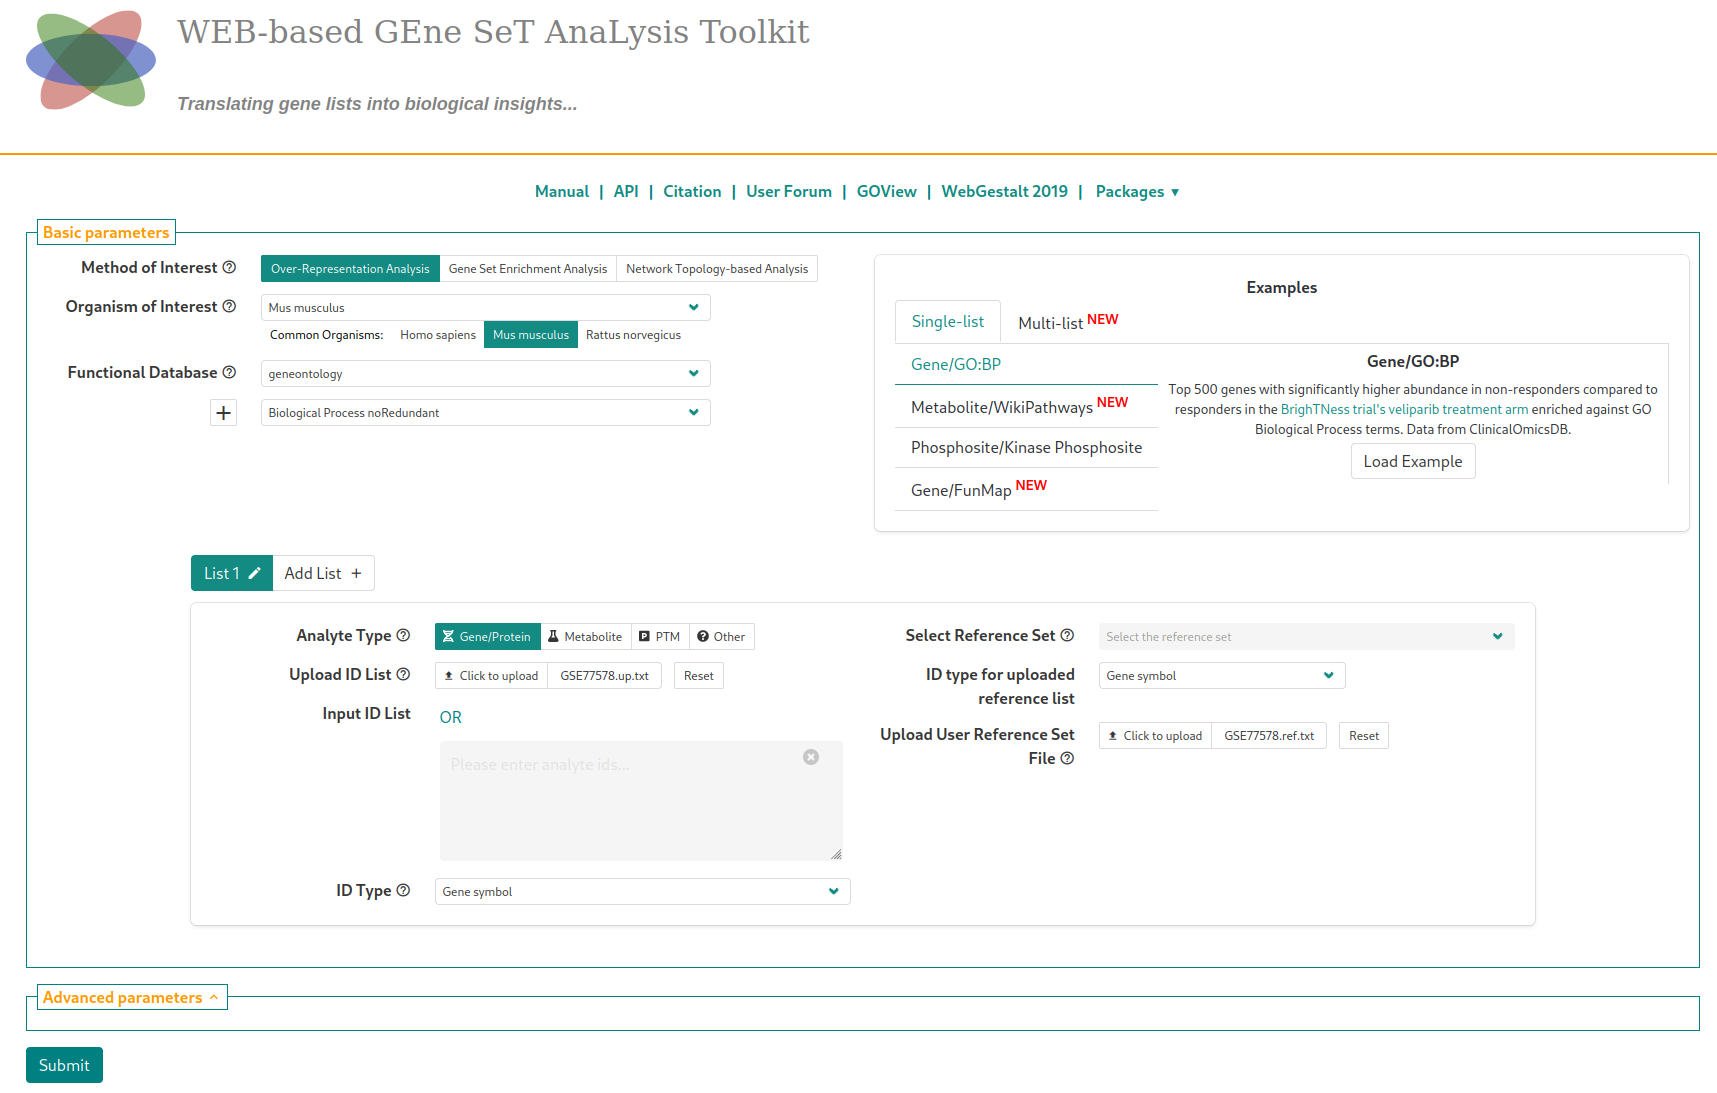
In the “Advanced parameters” tab, choose to display enriched pathways with FDR lower than 20% (“Significance level”) instead of the top enriched pathways (in terms of statistical value). The analysis is started by clickling on the “Submit” button. Running the analysis on the list of up-regulated genes with the default parameters (after a short waiting time) will lead to this page
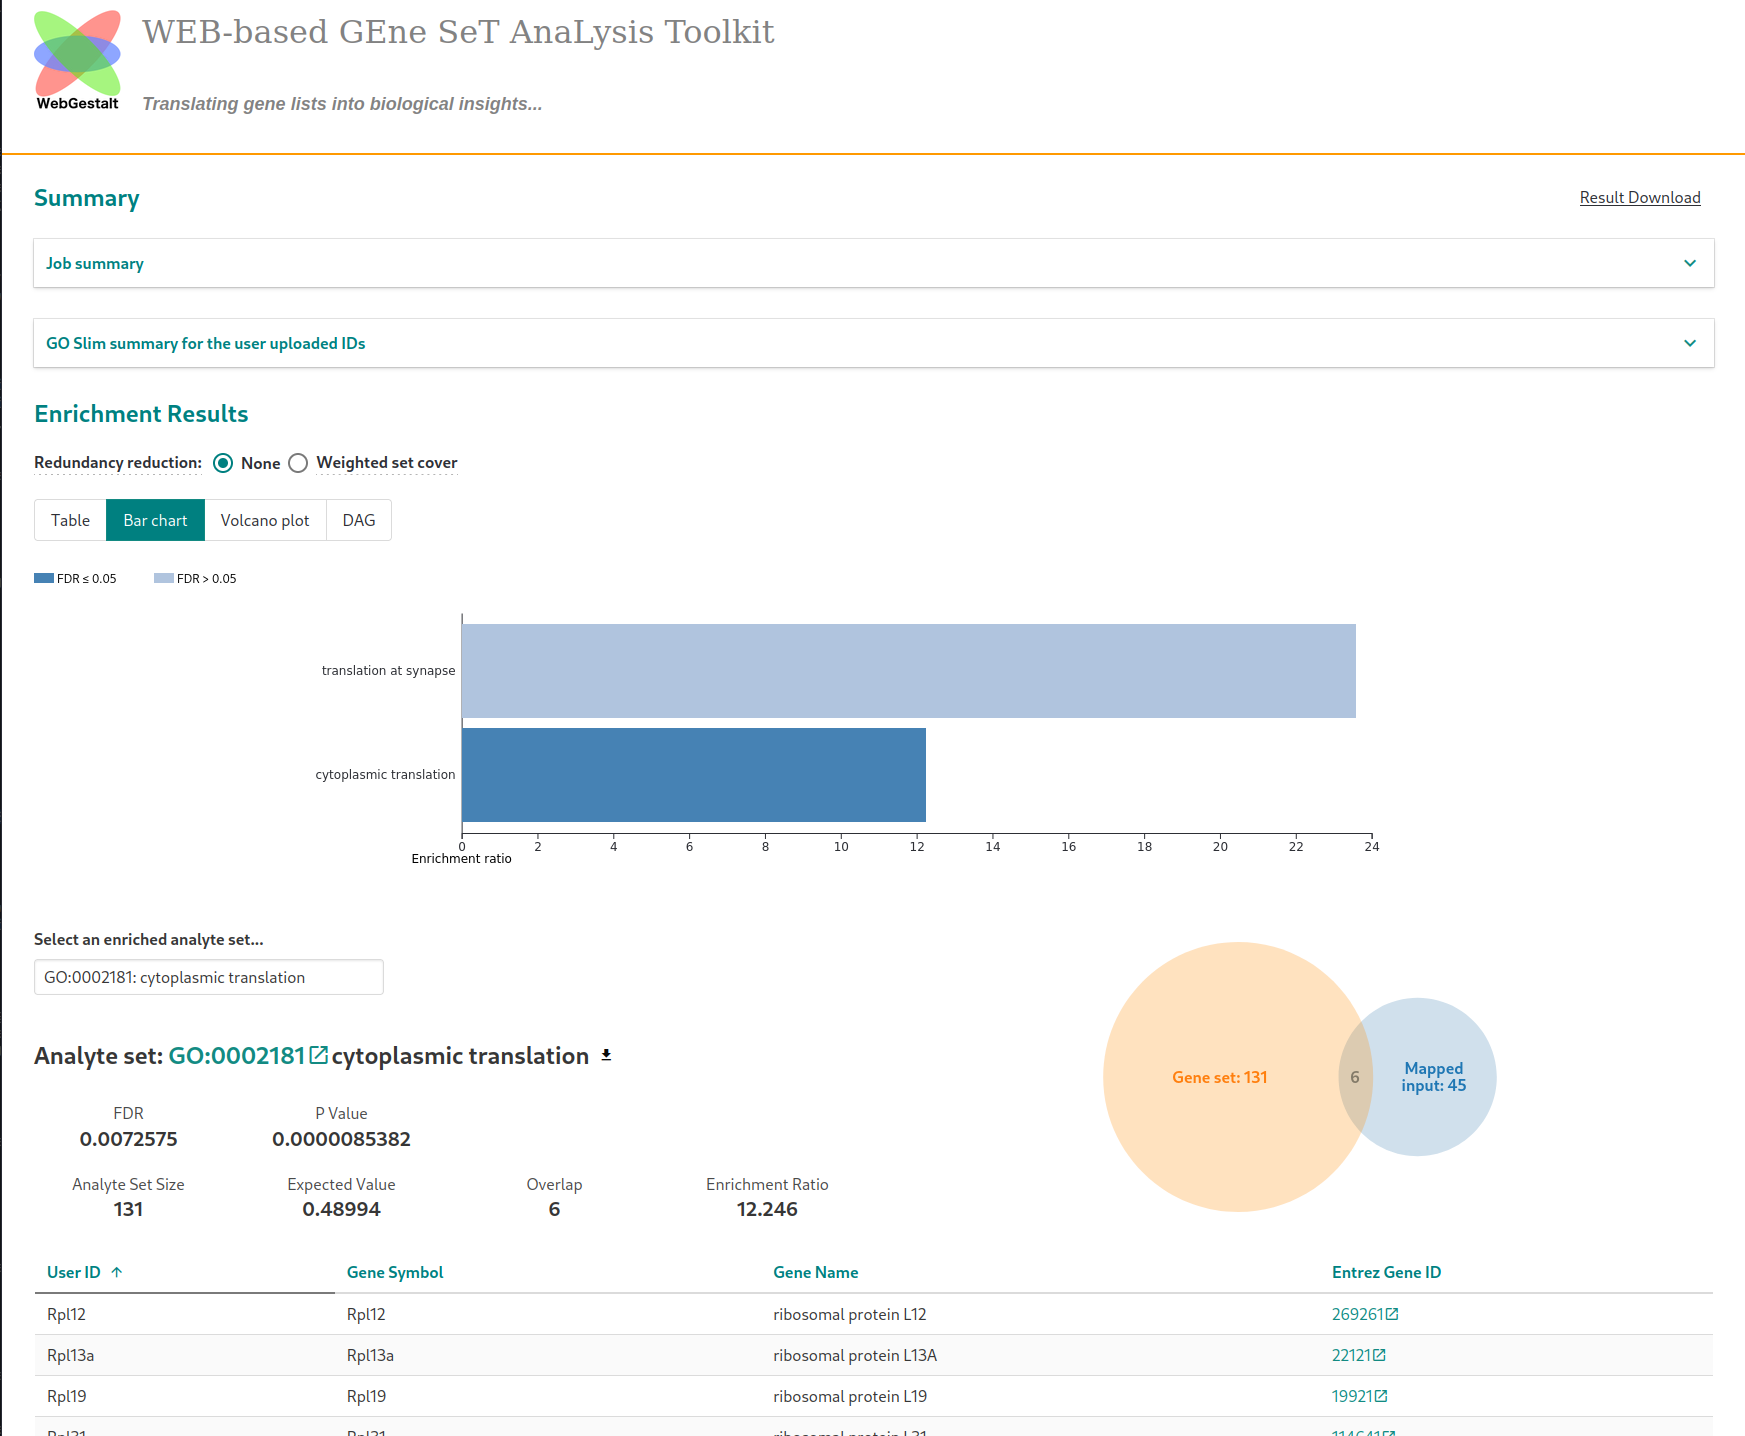
The barplot displays the name of significantly (FDR$<20\%$) enriched pathways along with their enrichment ratios. For a fixed pathway, the enrichment ratio is the number of genes from this pathway among genes of interest over the expected number of genes, that is, the number observed by chance. The higher the enrichment ratio, the more strongly overrepresented the pathway.
1.3 Common pitfalls in ORA
Selection of gene annotations
In ORA, a gene cannot belong to more than one functional family (hence the “NoRedundant” name for the annotation).
Selection of genes of interest
We selected up-regulated and down-regulated genes by a threshold (1.301) on the score. In practice, this choice can seem arbitrary, as, for instance, a gene with a score of $1.29$ might be worth including in the analysis as well… Moreover, when the total number $n$ of genes of interest is low, ORA returns unreliable results, as the value of $p$ is greatly impacted by the value of $k$. Ideally, we would like that having just another gene from a pathway among the genes of interest does not change much the enrichment of that pathway.
Selection of the background genes
You might have noticed that WebGestalt suggests using as a background list the full mouse genome (the “Select Reference Set” field). However, we strongly advise against using them. Indeed, for instance, in our mouse brain data set, the genes for which a non-negligible activity is detected are most likely related to brain functions. When comparing any subset of those genes to the full genome, enrichments in brain-related pathways might occur, biasing the analysis.
Identification of enriched pathways
One might be tempted to have a look at all enriched pathways (including those which are not significantly enriched, that is, with a large FDR), especially when there are no significantly enriched pathways. However, such pathways (for instance, with FDR$>20\%$) do not constitute strong evidence for downstream conclusions. One of the most common causes for this is the lack of data. A lot of studies only comprise 3 samples per sample group (control or treated), which is seldom enough for a robust analysis. As a rule of thumb, 6-7 samples per group are much better. Aggregating data from other comparable sources$^{***}$ might be an idea to get meaningful enrichments.
Conclusion
This blog post has described the principle of one approach for pathway enrichment, which is ORA. In the next blog post, we will see another approach, named Gene Set Enrichment Analysis (GSEA), which will solve the thresholding problem for the selection of genes of interest. More importantly, GSEA will allow the joint analysis of down-regulated and up-regulated genes.
Footnotes
$^{*}$ Which might lead to a supplementary source of error in discovery…
$^{**}$ That value corresponds to an adjusted $p$-value cutoff of $5\%$ and an absolute value of fold change equal to $2$, which are standard cutoff values: $-\log_10(0.05) \times \log_2(2) \approx 1.30$.
$^{***}$ That requires some data browsing, cleaning and processing to eliminate batch effect, for instance.
References
[1] Elizarraras, John M., et al. “WebGestalt 2024: faster gene set analysis and new support for metabolomics and multi-omics.” Nucleic Acids Research (2024): gkae456.
[2] Srivastava, Prashant K., et al. “A systems-level framework for drug discovery identifies Csf1R as an anti-epileptic drug target.” Nature communications 9.1 (2018): 3561.
[3] Robinson, Mark D., et al. “FunSpec: a web-based cluster interpreter for yeast.” BMC bioinformatics 3 (2002): 1-5.